15 min read
Preparations for Next Moonwalk Simulations Underway (and Underwater) At the end of 2022, 65 percent of the Western United States was in severe drought, the result of a two decades long mega drought in the Colorado River Basin that had captured headlines around the world.
However, it was flooding, not drought, that was making headlines when we began our research for this story about OpenET, a revolutionary new online platform geared towards helping farmers and water managers monitor and reduce water use in watersheds where supplies were not keeping up with demand.
The start of 2023 brought flooding to many counties in California, leaving 68 percent of the state with suddenly little to no drought. And caused Forrest Melton, the NASA Project Scientist for OpenET and Associate Program Manager for agriculture and water resources with the NASA Earth Action program, to pause our video interview after a tree fell down outside his Bay Area home on a rainy day in March, 2023.
Coming online again after calling the fire department, Melton didn’t seem all too optimistic that the wet conditions would last. “California tends to swing between the two extremes of drought and flood,” Melton said. He referenced the 2016/17 winter which had particularly high precipitation but was followed by dry conditions during the following years, before the relief brought by the heavy rains, and flooding, in early 2023.
According to NOAA’s National Integrated Drought Information System it will take more than one wet winter to replenish groundwater in many parts of the western United States. Groundwater levels across the California Central Valley and many parts of the Ogallala Aquifer continue to decline. The need for better water management remains essential, and yet the data necessary to support new approaches has not been broadly available.
Enter the OpenET project, a multi-disciplinary, collaborative effort to make satellite-based evapotranspiration (ET) data available to the public. Melton describes the project as providing invaluable and scientifically robust data at all scales, “that can be used to support day to day decision making and long range planning to try to solve some really long standing and important water management challenges in the West.”
What is Evapotranspiration?
Evapotranspiration is the combined process of evaporation and transpiration, both of which transfer water from the land surface to the atmosphere as water vapor. Evaporation transforms water from the surface of the ground or bodies of water into water vapor, while transpiration is water vapor that is evaporated from plant tissues and escapes through the stomata, the tiny pores in plant leaves and stems. It is a process that is happening all around us almost all the time, but because water vapor is invisible to the human eye, it is very hard to measure on the ground.
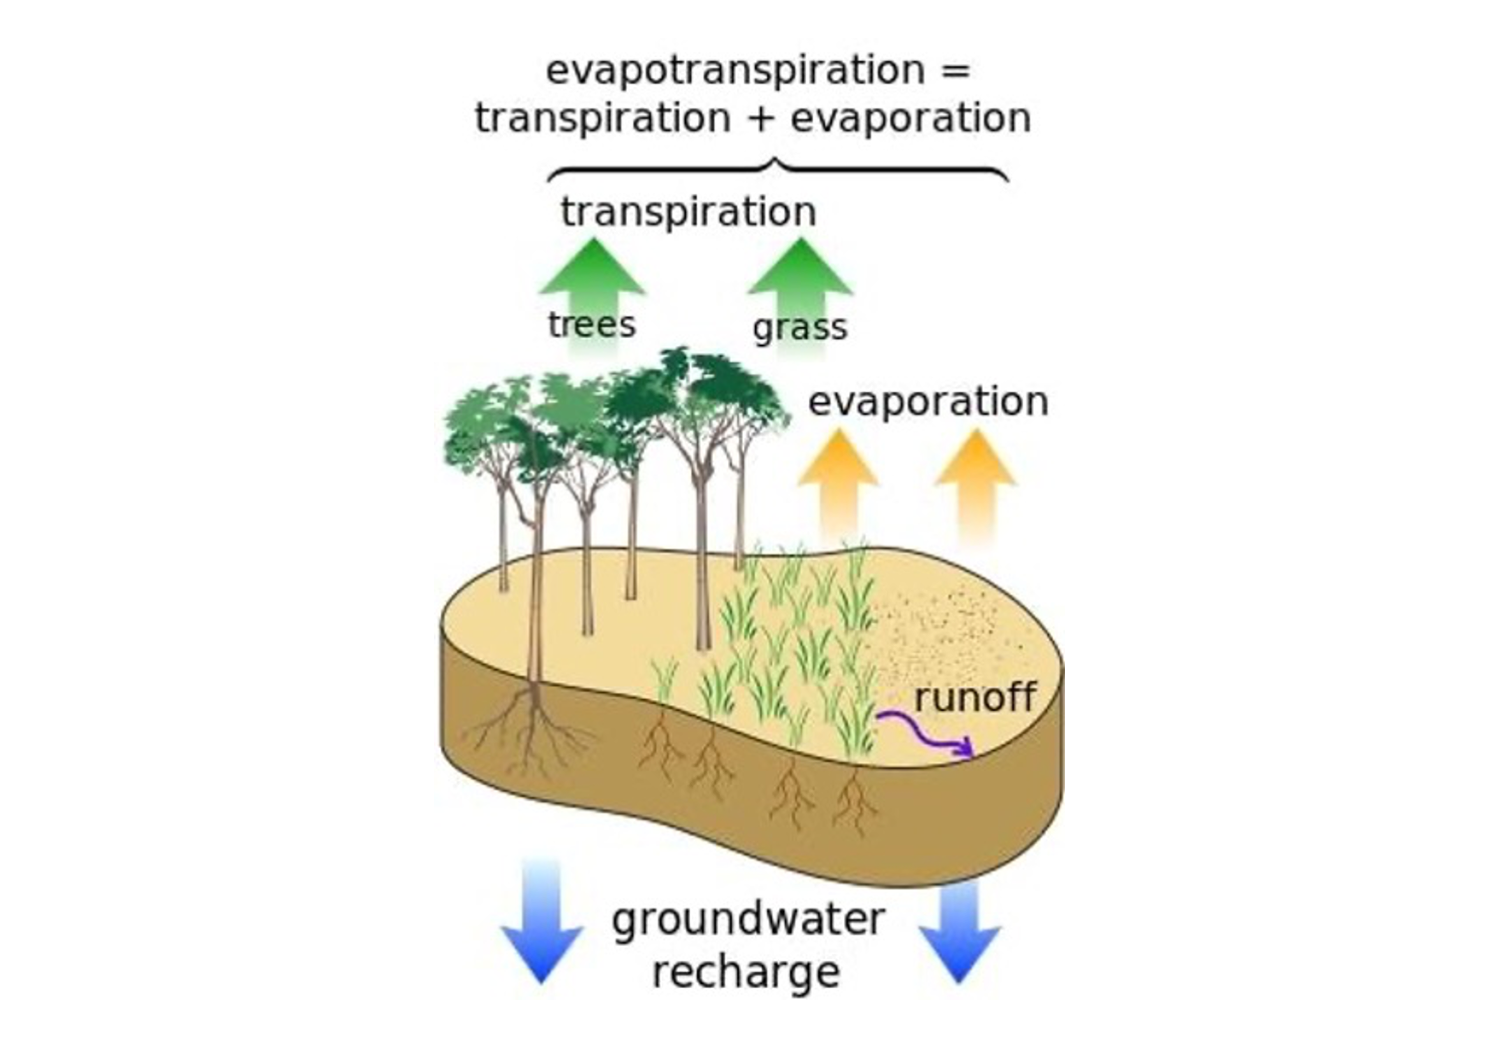 A conceptual diagram of near-surface hydrology.M. W. Toews
To understand the effect evapotranspiration has on a local water cycle, picture a large decorative fountain. Typically, these fountains recycle the same water over and over. As a fountain runs, water is pumped out of the fountain heads, falls back into the fountain’s basin, and then flows back through the pipe system before starting the process all over again. We can think of the water remaining within this fountain’s local water system as non-consumptive water use. Some water, however, will be lost from the fountain’s local water system by evaporating from the pool’s surface or mist from the fountain’s spray.
Imagine the fountain also has lily pads growing in its basin. The lily pads will use the fountain’s water to survive and grow, losing some of that water to transpiration. The total water lost is evapotranspiration, and is considered consumptive water use, because it cannot be reused by the fountain. Tracking evapotranspiration can tell you how much water is removed or “depleted” from a local water system, and how much water needs to be added back in to support plant growth and maintain a healthy balance between water supply and water use. If too much water leaves the fountain, it will stop running. If too much water is added, it will overflow.
These concepts can be applied more broadly to the hydrologic cycle as a whole, and evapotranspiration data can play an important part in designing and implementing sustainable water management practices to combat larger issues like drought, as well as both short and long-term reductions in water availability. Historically, ET data have been obtained from ground-based instruments and methods, such as weighing lysimeters, which weigh soil and plants to track the water volume lost by evaporation or transpiration. Another common method is called eddy covariance, which calculates the amount of water vapor transported away from the land surface by wind eddies as they move across the land surface. But both are expensive and difficult to install and maintain, and measurements are only representative of a small portion of an individual agricultural field. It is cost prohibitive to collect these measurements over larger areas.
What makes OpenET different?
The OpenET team saw the important niche left open by traditional evapotranspiration measurement methods and filled it. They built upon decades of research funded by NASA, USDA and USGS and developed a new platform that can take easily accessible and already available data from satellite programs, like Landsat, and combine it with weather data to calculate the ET for every quarter acre of land. Satellites can record information like the Earth’s surface temperature and how much of the incoming light from the sun is being reflected back out to space. OpenET is able to use physically-based mathematical models to combine the satellite and weather data and output accurate data on evapotranspiration rates and volumes.
This information is then made easily accessible through OpenET’s Data Explorer, a free web-based tool that allows anyone with an internet connection to access the data OpenET provides. Users begin by selecting an area of interest from a map of the western United States that provides data at the satellite resolution of a quarter-acre, and also broken down into known areas of interest and individual agricultural fields, each color coded with a heat map of evapotranspiration. Cooler colors indicate higher rates of evapotranspiration while warmer colors indicate lower rates. Users can zoom into specific areas on the map, and with just a click, a chart pops up showing the evapotranspiration trends for a given area, for the current year and the past five years.
The chart can show monthly ET trends, useful for understanding seasonal fluctuations, and also cumulative trends, useful for understanding year-to-year changes in evapotranspiration. “The OpenET team took a user-driven design approach from the beginning, and each element of the Data Explorer and the open data services is there because a water manager or farmer asked for it,” Melton explained. As we played around with the map, it became apparent how much work was put into developing this project. Scientists needed to improve models and assess the accuracy of data, programmers had to develop the user interface and data services, designers needed to make the interface intuitive enough to be impactful, agriculture and environmental groups needed to help validate the model’s accuracy, and users of all types needed to provide requirements and then test the product to make sure their needs were actually met.
The OpenET consortium includes NASA, USGS, USDA Agricultural Research Service (ARS), Environmental Defense Fund (EDF), Google Earth Engine, California State University Monterey Bay (CSUMB), Desert Research Institute (DRI), Habitat Seven, Chapman University, Cornell University, University of Nebraska-Lincoln and close to a dozen other universities and experts across the U.S. NASA Ames Research Center and CSUMB have played key roles in the scientific and technical leadership of the effort from the outset, working closely with DRI, EDF and the recently formed non-profit OpenET, Inc. In addition, over 100 partners from the water management, agriculture and conservation community provided user requirements and assisted with the design and testing of the OpenET platform and tools.
“OpenET would not be possible without the contributions of each one of those partners,” Melton said. “Both on the implementation side and those who are translating the data from OpenET into solutions to long standing challenges.”
 Map of farmlands showing ET data for 2024. The cooler colors represent higher levels of evapotranspiration (ET), while warmer colors indicate areas with less ET.OpenET
Models like those built into OpenET can be extremely useful tools for understanding patterns in ET and water use, but are only helpful if their accuracy is known. The OpenET science team recently completed the largest accuracy assessment to date for field-scale satellite-based ET data, comparing the satellite data to ground-based measurements at more than 150 sites across the U.S. Led by John Volk of the Desert Research Institute, the study was published in Nature Water earlier this year. A key finding was that across all sites, an ensemble value computed from six different ET models performed the best overall, leveraging the strengths of each individual satellite-driven model.
However, the study also found that some models performed best for particular crop types or regions, which is important information for water managers and farmers who need the most accurate data possible. Publishing the results as an open access study with all data and analysis made publicly available was also important to build trust in the data. While the study highlighted some limitations of the models and priorities for future research, the rigorous and reproducible accuracy assessment helps to build user confidence that they can use the data, while being aware of the expected accuracy for different applications of the data.
Bridging the Gap Between Farmers and Resource Managers
OpenET has already contributed to one significant win for farmers that affects how water use will be monitored and reported in the Sacramento-San Joaquin Delta.
This inland river delta covers 750,000 acres and is an important water resource in California, but one where accelerated demand combined with habitat loss and water quality issues has led to major concerns. In the Delta, large portions of the agricultural land are below sea level. Levees protect the fields and contain the river channels that supply water for irrigation. In 2023, the state began requiring farmers to maintain a water meter or measuring device on each diversion, where water is diverted from a river for irrigation. However, this measurement proved challenging and costly as there are thousands of diversions in the Delta, and the measuring equipment was inaccurate and difficult to maintain in this environment. In addition, water users also had to pay for meters at the locations where water that drained from the fields was pumped back over the levees and into the river channels.
 The Sacramento-San Joaquin River Delta is a major water resource in California.Matthew Trump
“Mostly, what the state was interested in was the consumptive use: how much (water) was actually removed from the supply in that region,” Melton said. “So, it’s the perfect place for using OpenET because evapotranspiration really is the majority of the consumptive use in the Delta, if not all of it.”
After the launch of OpenET, farmers in the Delta worked with the Delta Watermaster, the California State Water Resources Control Board, the OpenET team and the Delta Measurement Consortium to develop an alternative compliance plan that used OpenET data to help streamline the water use required reporting for this complex region. Once the alternative compliance plan was approved, Forrest Melton and Will Carrara of NASA worked with the state Water Resources Control Board, the Delta Watermaster and water management agencies, and Jordan Harding of HabitatSeven to implement this solution. The Delta Alternative Compliance Plan, also known as the Delta ACP, allows farmers to use OpenET data to estimate their water usage; enabling farmers to complete their use reports in a matter of minutes.
“It’s the first time that satellite-based evapotranspiration data has been automatically integrated with a state-managed water reporting system,” Melton said.
Last year, more than 70% of farmers in the Bay-Delta region chose to use OpenET and to report their water use through the Delta ACP website, and they expect this percentage to continue to increase over time.
“The best part is that it is saving farmers hundreds of hours on preparing and submitting reports, avoiding millions of dollars in costs for farmers to deploy and maintain meters, and giving the state consistent and reproducible data on water use that has been reviewed and approved by the water user,” Melton said.
According to Delta Watermaster, Jay Ziegler, this approach has a clear benefit in the unique water flow setting of the Delta. “In reality, OpenET – and the use of publicly accessible data measuring ET is the only way to really discern consumptive use of water in the Delta on a reliable basis,” Ziegler said. “Candidly, we don’t really have a viable “plan B” in the absence of applying Open ET for water use reporting.”
In reality, OpenET – and the use of publicly accessible data measuring ET is the only way to really discern consumptive use of water in the Delta on a reliable basis.  Jay ziegler
Sacramento-San Joaquin Delta Watermaster
Water Beyond Borders
As water scarcity is increasingly becoming an urgent issue all around the world, it’s easy to imagine how many countries could benefit from OpenET data.
OpenET’s first international partnership is led by Anderson Ruhoff, a professor in Hydrology and Remote Sensing at the Federal University of Rio Grande do Sul, Brazil, where his team developed an evapotranspiration model called geeSEBAL for Brazil’s Water Agency.
Ruhoff learned about OpenET while he was in the US on a visiting professorship in Nebraska. He was intrigued and reached out to Melton who encouraged him to attend an upcoming conference in Reno, Nevada, where OpenET would be featured. The conference was due to start in just a few days time.
“So I had to find a last minute ticket to Reno and I’m glad I bought it, because when I arrived there they invited me to join Open ET. It was quite a coincidence,” Ruhoff said, smiling as he remembered the spontaneous decision. “We adapted our model for the US and started to participate in their work.”
In March, 2024, Ruhoff and OpenET launched an extension of the tool, called OpenET Brazil, with financial support from the Agência Nacional de Águas e Saneamento Básico (ANA), the Brazilian national water agency. The tool, called OpenET Brazil, will have similar goals as OpenET in the U.S., and the data collected will help improve Open ET’s accuracy overall.
Melton feels this will be a “great test case” for both working with new environmental conditions (in Brazil there frequently is more cloud cover than in the US during key parts of the growing season) and also developing new collaborations.
“The partnership will help us figure out how we can work with international partners to make the ET data useful,” Melton said. “The key aspect of our approach to geographic expansion is that leading scientists in each country and region, like Dr. Ruhoff, will lead the implementation, accuracy assessment, and the development of applications and partnerships for their country.”
Brazil has one of the world’s largest sources of freshwater, the Amazon River, and yet it can still be affected by drought. This is partly due to the fact that deforestation in the Amazon Rainforest has an impact on the entire region’s water cycle. Trees draw water up from the soil and during photosynthesis they release vapor into the atmosphere. This water vapor will accumulate and form precipitation. Trees are “basically a huge water pump,” Ruhoff said, and the Amazon Rainforest is large enough that it helps to produce the rainy season. But when deforestation is allowed to happen over large areas, that mechanism is interrupted. As a result of this disruption, the dry season is predicted to intensify, becoming longer and dryer, which in turn can affect crop production in Brazil as well as the rainfall that is critical for sustaining water supplies in Brazil and other areas of South America.
“Water doesn’t see borders. It doesn’t follow our rules,” Ruhoff said. “Deforestation in one place can affect people thousands of kilometers away.”
Water doesn’t see borders. It doesn’t follow our rules. Deforestation in one place can affect people thousands of kilometers away. Anderson Ruhoff
Professor of Hydrology and Remote Sensing, Federal University of Rio Grande do Sul, Brazil
Studying evapotranspiration can reveal the impacts of deforestation with even more clarity. And importantly, it’s also public information. “So not only the farmers and water managers but every citizen can check how much water is being used in their area, especially during drought. It’s democratic information in that way,” Ruhoff said. “I think it’s important to have this information openly available and to try and reach as many people as possible.”
Melton feels there’s the potential to expand the project, if more people like Ruhoff are there to lead the way.
“There’s huge potential, but there do need to be stakeholders that come to the table and say that this is something that they’re interested in,” Melton said. “Water is so important and at times so contentious that it’s really important the data is seen as trusted. When there is a local leader, that substantially increases the likelihood that it will be trusted, and most importantly, used to bring people together to develop solutions.”
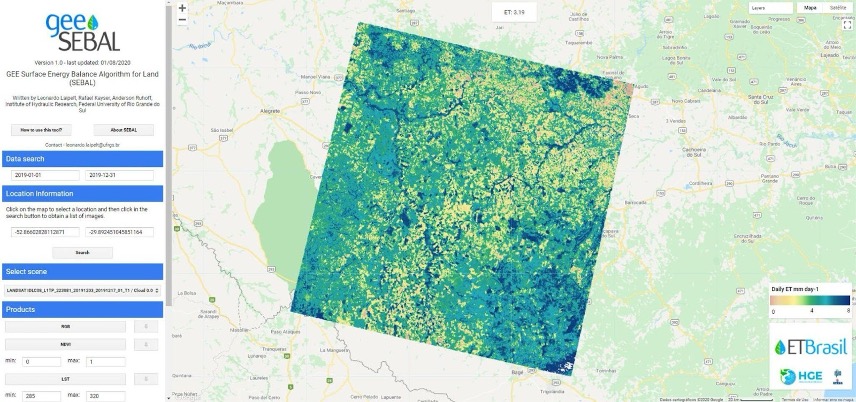 The geeSEBAL application that Anderson Ruhoff’s team developed, which now informs the OpenET platform. Science Direct/Anderson Ruhoff
Even when you live in a water-scarce region like California it’s easy to take water for granted. What platforms like OpenET can do for us, however, is make water, even in its most diffuse form, more visible to everyone.
Written by Jane Berg and Rachel Sender, co-published with the Bay Area Environmental Research Institute
To learn more about OpenET, visit https://etdata.org/
Program Contact:
Forrest Melton
NASA Ames Research Center
forrest.s.melton@nasa.gov
 3 min read NASA Activates Resources to Help Assess Impacts from Hurricane Milton Article 2 days ago
  1 min read RCRA Permit Modification Article 4 days ago
 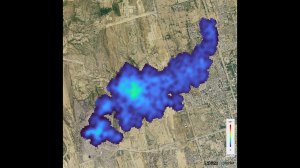 4 min read First Greenhouse Gas Plumes Detected With NASA-Designed Instrument Article 4 days ago
 Keep Exploring Discover More Topics From NASA Missions