
 21 min read
A Decade of Global Water Cycle Monitoring: NASA Soil Moisture Active Passive Mission Introduction
The NASA Soil Moisture Active Passive (SMAP) mission, launched in 2015, has over 10 years of global L-band radiometry observations. The low frequency [1.4 GHz frequency or 21 cm (8 in) wavelength] measurements provide information on the state of land surfaces in all weather conditions – regardless of solar illumination. A principal objective of the SMAP mission is to provide estimates of surface soil moisture and its frozen or thawed status. Over the land surface, soil moisture links the water, energy, and carbon cycles. These three cycles are the main drivers of regional climate and regulate the functioning of ecosystems.
The achievement of 10 years in orbit is a fitting time to reflect on what SMAP has accomplished. After briefly discussing the innovative measurement approach and the instrument payload (e.g., a radiometer and a regrettably short-lived L-band radar), a significant section of this article is devoted to describing the mission’s major scientific achievements and how the data from SMAP have been used to serve society (e.g., applied sciences) – including SMAP’s pathfinding role as Early Adopters. This content is followed by a discussion of how SMAP has dealt with issues related to radio frequency interference in the L-Band region, a discussion of the SMAP data products suite, future plans for the SMAP active–passive algorithm, and a possible follow-on L-band global radiometry mission being developed by the European Union’s Copernicus Programme that would allow for data continuity beyond SMAP. This summary for The Earth Observer is excerpted from a longer and more comprehensive paper that, as of this article’s posting, is being prepared for publication in the Proceedings of the Institute of Electrical and Electronics Engineers (IEEE).
SMAP Measurement Approach and Instruments
The SMAP primary and operating instrument is the L-band radiometer, which collects precise surface brightness temperature data. The radiometer includes advanced radio frequency interference (RFI) detection and mitigation hardware and software. The radiometer measures vertical and horizontal polarization observations along with the third and fourth Stokes parameters (T3 and T4) of the microwave radiation upwelling from the Earth. The reflector boom and assembly, which includes a 6 m (20 ft) deployable light mesh reflector, is spun at 14.6 revolutions-per-minute, which creates a 1000 km (621 mi) swath as the SMAP satellite makes its Sun-synchronous orbit of the Earth – see Figure 1. This approach allows coverage of the entire globe in two to three days with an eight-day exact repeat. The radiometer instrument is calibrated monthly by pointing it to the deep sky.
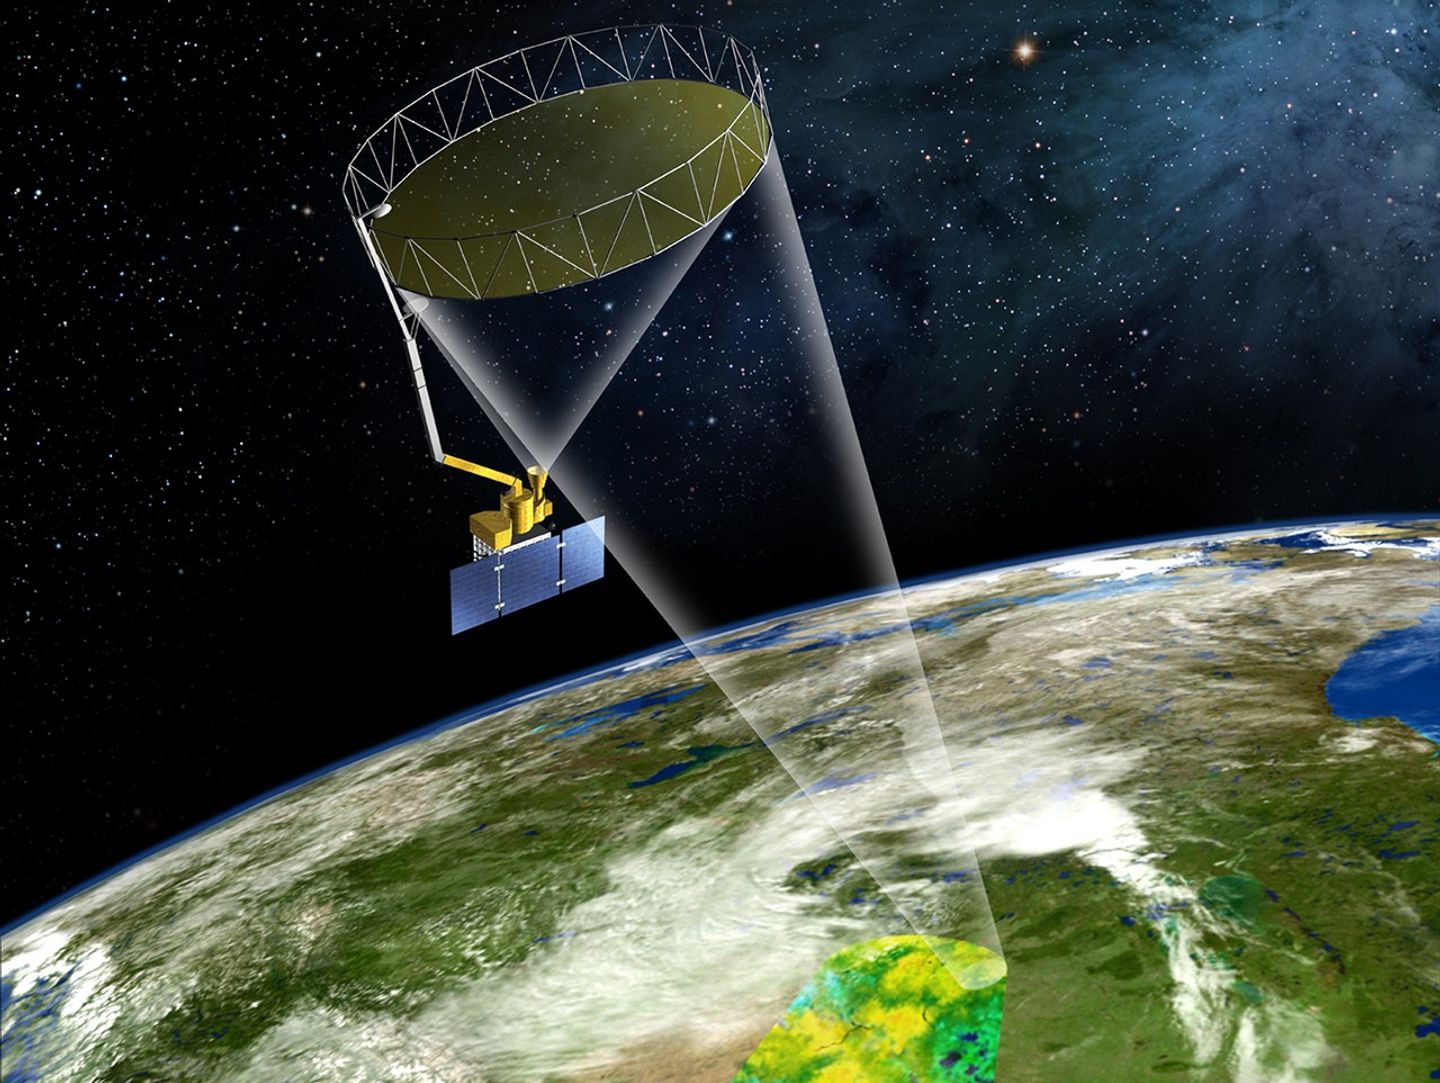 Figure 1. An artist’s rendering of the SMAP Observatory showing both the radiometer and radar.Figure credit: NASA/Jet Propulsion Laboratory/California Institute of Technology The original SMAP instrument design included a companion L-band radar, which operated from April through early July 2015, acquiring observations of co- and cross-polarized radar backscatter at a spatial resolution of about 1 km (0.6 mi) with a temporal revisit of about three days over land. This data collection revealed the dependence of L-band radar signals on soil moisture, vegetation water content, and freeze thaw state. The radar transmitter failed on July 7, 2015. Shortly thereafter, the radar receiver channels were repurposed to record the reflected signals from the Global Navigation Satellite System (GNSS) constellation in August 2015, making SMAP the first full-polarimetric GNSS reflectometer in space for the investigation of land surface and cryosphere.
Scientific Achievements from a Decade of SMAP Data
A decade of SMAP soil moisture observations have led to a plethora of scientific achievements. The data have been used to quantify the linkages of the three main metabolic cycles (e.g., carbon, water, and energy) on land. They have also been used to improve drought assessments and flood prediction as well as the accuracy of numerical weather prediction (NWP) models. They are also used to measure liquid water and thickness of ice sheets, and sea surface salinity. The subsections that follow describe how SMAP data are being put to use in myriad ways that benefit society.
Quantifying Processes that Link the Terrestrial Water, Energy, and Carbon Cycles
The primary SMAP science goal is to develop observational benchmarks of how the water, energy, and carbon cycles link together over land. Soil moisture is the variable state of the land branch of the water cycle. It links the water cycle to the energy cycle through limiting latent heat flux – the change in energy as heat exchanges when water undergoes a phase change, such as evapotranspiration at the land–atmosphere interface. Soil moisture also links the water and carbon cycles, which is evident through plant photosynthesis. SMAP global observations of soil moisture fields, in conjunction with remote sensing of elements of the energy and carbon cycles, can reveal how these three cycles are linked in the real world as a benchmark for weather and Earth system models.
Photosynthesis is down-regulated by both the deficit in water availability and the lack of an adequate amount of photosynthetically active radiation. Global maps reveal how soil moisture and light regulate photosynthesis – see Figure 2. These benchmark observational results can be used to assess how Earth system models link to the three main metabolic cycles of the climate system.
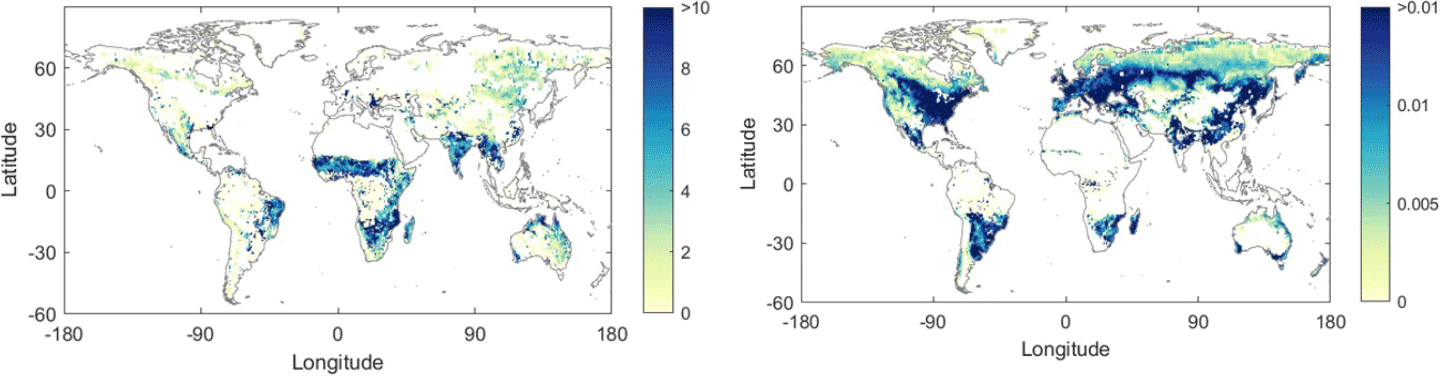 Figure 2. Observed regulation of photosynthesis by water availability [left] and light availability [right]. Blue denotes greater limitation. Photosynthesis rates for both maps determined using solar-induced fluorescence (SIF) measurements (mW/m2 nm sr) from the Tropospheric Ozone Monitoring Instrument (TROPOMI) on the European Union’s Copernicus Sentinel-5P mission. Water availability was determined using soil moisture (SM) measurements from the Soil Moisture Active Passive (SMAP) mission. Light availability was determined using measurements of photosynthetically active radiation (PAR) from the Moderate Resolution Imaging Spectroradiometer (MODIS) on NASA’s Terra and Aqua platforms. The resulting maps show the model slope (mW/m2/nm/sr) of the estimated SIF-SM relationship in the water-limited regime [left] and the model slope (10-3/nm/sr) of estimated SIF-PAR relationship in the light-limited regime [right].Figure credit: Jonard et al (2022) in Biogeosciences Development of Improved Flood Prediction and Drought Monitoring Capability
SMAP products have also been widely used in applied sciences and natural hazard decision-support systems. SMAP’s observation-based soil moisture estimates offer transformative information for managing water-related natural hazards, such as monitoring agricultural drought – defined as a persistent deficit in soil moisture – and flood volumes – defined as the landscape’s water absorption capacity during precipitation events. The SMAP project produces a parallel, near-real-time data stream that is accessed by a number of federal and state agencies in decision-support systems related to drought monitoring, food security, and landscape inundation and trafficability.
Enhancing Weather and Climate Forecasting Skill
SMAP’s enhancement of numerical weather prediction, model skill, and reduction of climate model projection uncertainties is based on the premise of the contribution of solar energy to weather and climate dynamics. Soil moisture has a strong influence on how available solar energy is partitioned into components (e.g., sensible heat flux versus latent heat flux) over land. The influence propagates through the atmospheric boundary layer and ultimately influences the evolution of weather.
To give an example, land surface processes can affect the evolution of the U.S. Great Plains low-level jets (GPLLJs). These jets drive mesoscale convective weather systems. Previous studies have shown that GPLLJs are sensitive to regional soil moisture gradients. Assimilation of SMAP soil moisture data improves forecasts of weakly synoptically forced or uncoupled GPLLJs compared to forecasts of cyclone-induced coupled GPLLJs. For example, the NASA Unified Weather Research and Forecasting Model, with 75 GPLLJs at 9 km (5.6 mi) resolution both with and without SMAP soil moisture data assimilation [SMAP data assimilation (DA) and no-DA respectively], shows how the windspeed mean absolute difference between SMAP DA and no-DA increase approximately linearly over the course of the simulation with maximum differences at 850 hPa (or mb) for the jet entrance and core – see Figure 3.
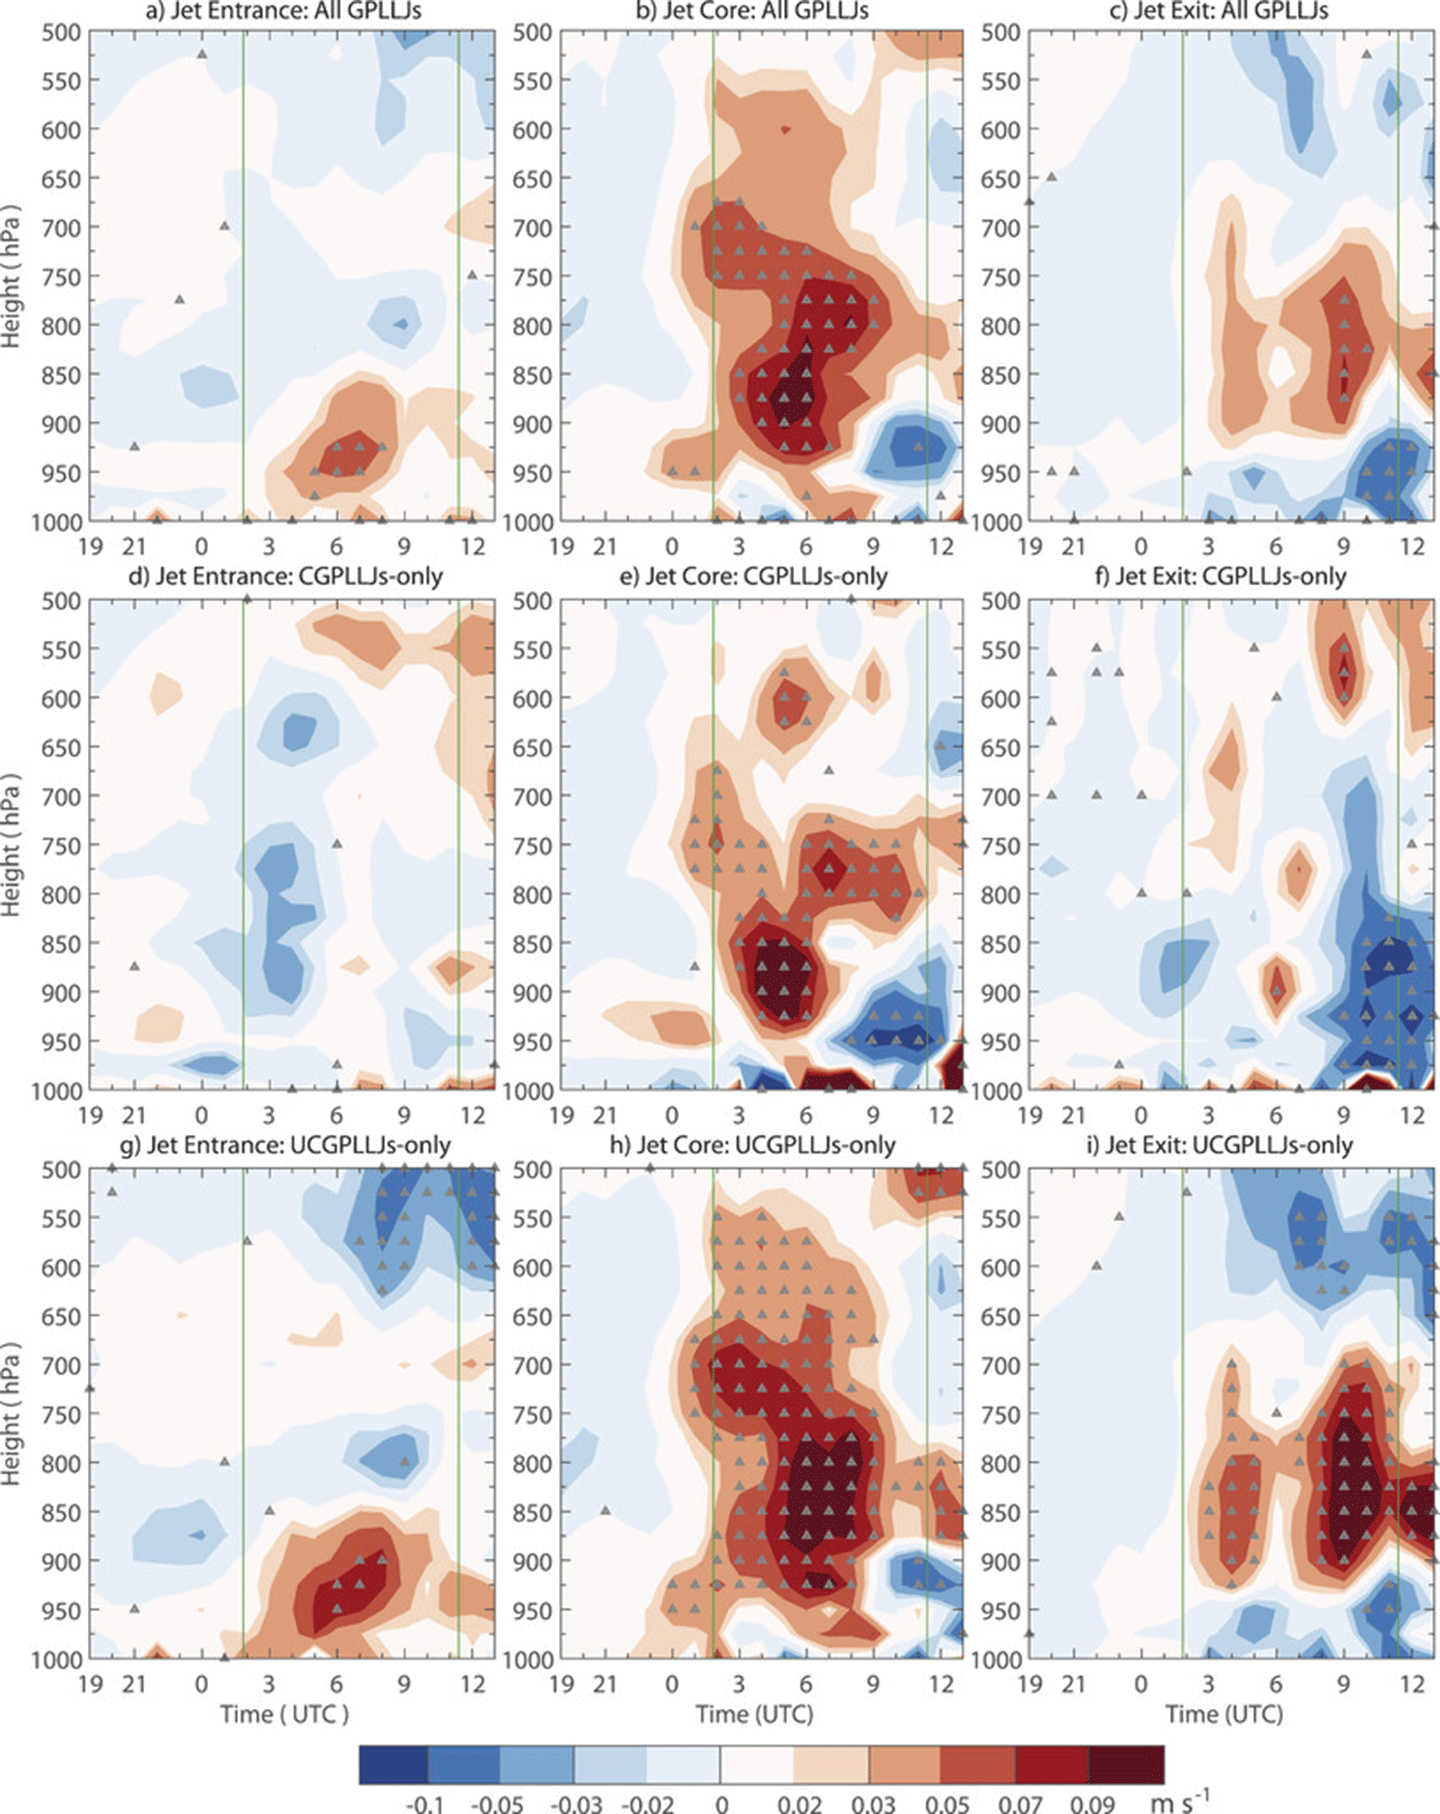 Figure 3. The impact of adding soil moisture data [SMAP data assimilation (DA) minus no-DA] to a model simulation from theNASA Unified Weather Research and Forecasting Model (NU-WRF)) of the Great Plains Low Level Jet (GPLLJ). The results show the mean over 75 independent GPLLJ events. The plots correspond to wind speed difference with height (y-axis) and time (hours on x-axis). The panels are for jet entrance [left], jet core [middle] and jet exit [right]. Soil moisture data assimilation enhances the intensity of the simulated GPLLJ. The stippling corresponds to 99% statistical confidence.Figure credit: Ferguson (2020) in Monthly Weather Review Measuring Liquid Water Content and Thickness of Ice Sheets
The mass loss of Greenland and Antarctica ice sheets contributes to sea-level rise – which is one of the most impactful and immediate damaging consequences of climate change. The melt rates over the last few years have raised alarm across the globe and impact countries with coastal communities. The cryosphere community has raised a call-to-action to use every observing system and model available to monitor the patterns and rates of land ice melt.
Surface melt affects the ice cap mass loss in many ways: the direct melt outflow from the ablation zone of the Greenland ice sheet, the structural change of the percolation zone of the Greenland ice sheet, changes in the melt water retention and outflow boundaries, changes in the structure of the Antarctic ice shelves, and destabilization of the buttressing of the glacier outflow through various processes (e.g., hydrofracturing and calving). The long-term climate and mass balance models rely on accurate representation of snow, firn, and ice processes to project the future sea level.
The SMAP L-band radiometer has relatively long wavelength [21 cm (8 in)] observations compared to other Earth-observing instruments. It enables the measurement of liquid water content (LWC) in the ice sheets and shelves as it receives the radiation from the deep layers of the snow/firn/ice column. Relatively high LWC values absorb the emission only partially, making the measurement sensitive to different liquid water amounts (LWA) in the entire column. Figure 4 shows the cumulative LWA for 2015–2023 based on SMAP measurements.
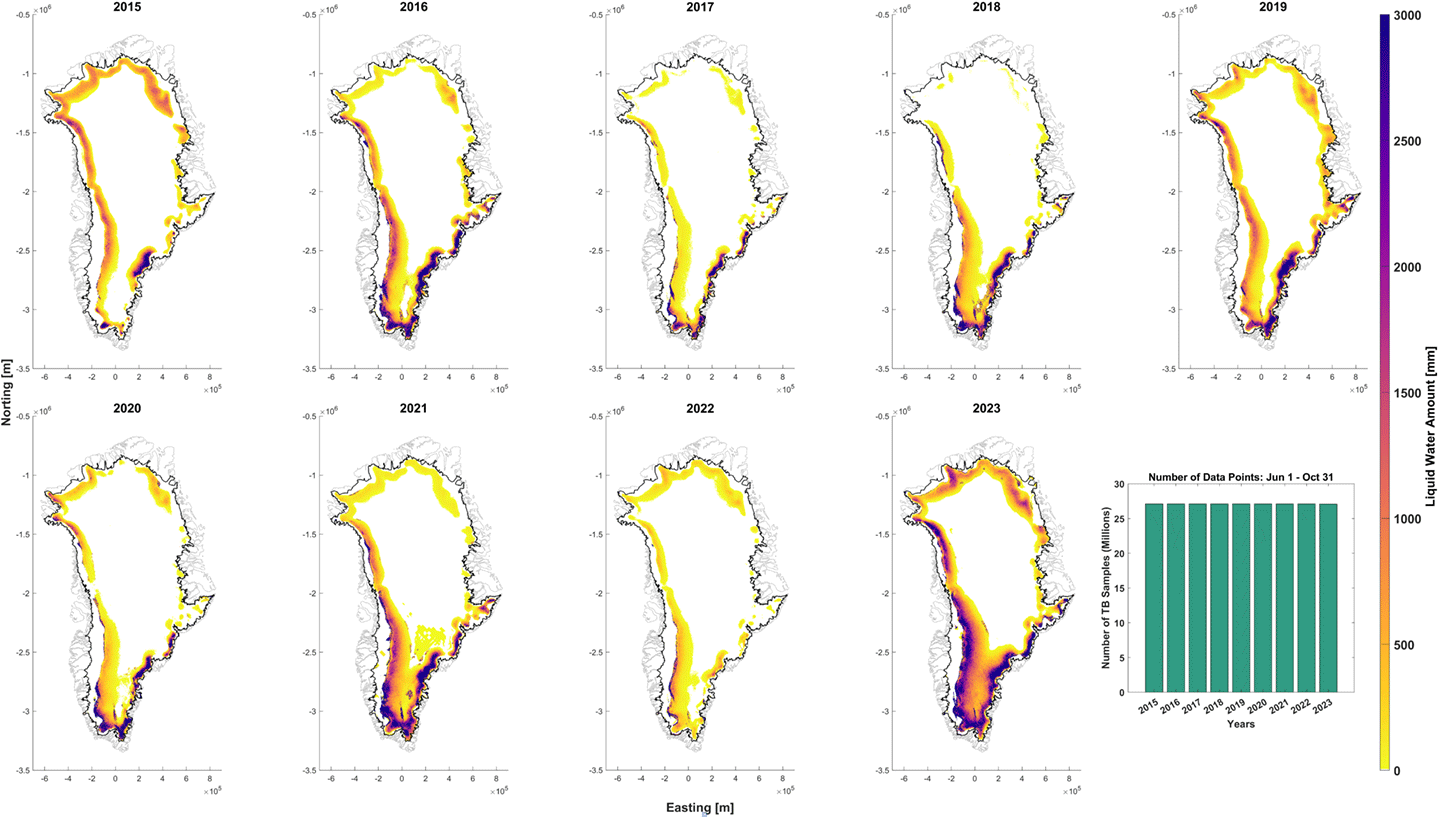 Figure 4. Total annual sum of SMAP daily liquid water amount (LWA) for 2015–2023. The black solid line on each map represents grid edges, and the grey color mask inside the ice sheet indicates melt detections by decreasing brightness temperature.Figure Credit: Andreas Colliander [Finnish Meteorological Institute]. The SMAP L-band radiometer has also been used to derive the thickness of thin sea ice [< 0.5–1 m (