Landsat Navigation Landsat Home Missions Landsat Next Landsat 9 Landsat 8 Landsat 7 Landsat 6 Landsat 5 Landsat 4 Landsat 3 Landsat 2 Landsat 1 News Latest News People of Landsat Q&As Newsletter Publications Data Overview Cal/Val Open Data Benefits Overview Agriculture & Food Security Disaster Management Ecosystems & Biodiversity Energy Resources Forest Management Human Health Urban Development Water Resources Wildfires Case Studies Outreach Multimedia About  An animation shows glaciers in the Karakoram range of Pakistan with monthly ice-velocity measurements overlaid from January through December. On Baltoro Glacier, red areas, indicating high ice velocities, propagate slowly downslope throughout the melting season. NASA/Chad Greene For the first time, scientists have created a comprehensive global dataset revealing how the world’s glaciers speed up and slow down with the seasons. Published in Science in November 2025, this groundbreaking study analyzed over 36 million satellite image pairs—including decades of Landsat data—to track the seasonal “pulse” of every major glacier on Earth.
The research, built off the ITS_LIVE ice velocity dataset from NASA’s Jet Propulsion Laboratory (JPL), reveals that seasonal glacier dynamics are becoming more pronounced as our planet warms, with the strongest seasonal variations occurring where annual maximum temperatures exceed freezing. Armed with this global perspective, researchers can continue to tease out patterns in glacial dynamics, identifying how factors including geology and hydrology impact seasonal melting.
Alex Gardner, a scientist at NASA JPL and a co-author on this study, explains how combining Landsat and radar data makes this research possible.
What makes this research unique from other studies of glacial dynamics? While many past studies have investigated seasonal changes in glacier flow, they have typically focused on single glaciers or specific regions. This localization makes it difficult to extrapolate findings to the rest of the world.
This study is the first to characterize seasonal flow changes for all the world’s glaciers. By applying a consistent methodology globally, we were able to isolate the universal relationships that drive seasonal fluctuations in glacier flow.
Why did you use Landsat in this work? Did it give you any insight that would have been difficult to get otherwise? We utilized data from Landsat 4/5/7/8/9, as well as ESA’s Sentinel 2 (optical) and Sentinel 1 (radar). Landsat offers an unmatched historical record with dense temporal sampling, particularly following the launch of Landsat 8 in 2013.
Three factors make Landsat imagery ideal for detecting “surface displacements” (the subtle pixel shifts used to estimate flow):
Near-exact repeat orbits: The satellite returns to the exact same position. Nadir viewing: The instrument looks directly downward. Stable instrument geometry: Distortion is minimized.  An animation shows glaciers in southeastern Alaska with monthly ice-velocity measurements overlaid from January through December. Red areas, indicating high ice velocities, begin to expand across Malaspina Glacier in spring. NASA/Chad Greene Why does the ITS_LIVE tool use the Landsat panchromatic band? Which bands from Landsats 4-5 are used? We measure surface displacement using a technique called feature tracking, which tracks the movement of specific surface details between a primary and a secondary image.
This approach works best with high-resolution imagery because there are more “features” to track. Therefore, we utilize the 15m panchromatic band. For the older Landsat 4/5 data, we use Band 2 (visible red) because it provides the best contrast over bright glacier surfaces.
You used Landsat data in combination with radar data to track ice velocity. What did each of these datasets contribute? Optical and Radar imagery are highly complementary and allow us to reconstruct a complete timeline of glacier flow:
Radar (Active Sensor): Can image the surface day or night, regardless of cloud cover, but struggles with feature tracking when the surface is melting (wet snow/ice). Optical (Passive Sensor): Requires sunlight and clear skies, but performs significantly better than radar when the surface is melting. How did you use radar data to validate uncertainties? We characterized uncertainty by analyzing retrieved velocities over stationary surfaces, such as bedrock. If our data showed high variability or movement in areas we know are not moving (like rock), we knew those measurements carried a higher uncertainty.
You found that glacier dynamics vary by region and glacier type. Why is it important to understand these global differences? A glacier’s response to external forces—such as meltwater lubricating the bedrock or changes in frontal melting—is highly dependent on local factors (e.g., the material beneath the glacier or the shape of the fjord). This makes it risky to assume that findings from one glacier apply to another.
Our study identified general patterns by observing nearly every glacier on Earth. A key finding was the relationship between temperature and flow:
Seasonal variability becomes prominent when annual maximum temperatures exceed 0°C.
The amplitude of that seasonal cycle increases with every degree of warming above that threshold.
Are there plans to incorporate Landsat 9 data into future studies? How would improvements in remote sensing technology (increased temporal revisit, spatial resolution, etc.) impact glacial velocity analyses? We are already ingesting Landsat 9 data into the ITS_LIVE project, which is designed to scale quickly with new sensors. Future sensor improvements offer a trade-off:
Increased Spatial Resolution: Allows us to track a higher number of surface features, improving flow estimates. Increased Temporal Frequency: Reduces data gaps caused by surface changes (loss of features), but can potentially increase error rates. This is because displacement is an accumulated signal; features move half the distance in an 8-day pair compared to a 16-day pair, making the movement harder to distinguish from background noise. Are there any research questions you’re interested in that build off this work? This study is just the tip of the iceberg. The dataset is rich with insights on glacier mechanics that are waiting to be uncovered. While we hope to make new discoveries in the coming years, we are equally excited to see what breakthroughs come from the wider scientific community exploring this open data.
 An animation shows an ice cap in the Canadian Arctic with monthly ice-velocity measurements overlaid from January through December. Red areas, indicating high ice velocities, expand across the ice cap during the summer months. NASA/Chad Greene
Explore More
Tracking Glacial Change with Landsat and Radar
5 min read NASA Scientist Alex Gardner highlights how Landsat made his research into the dynamics of glacial flow possible.
Feb 4, 2026 Article 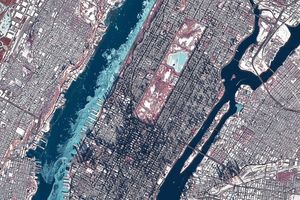
3 min read Ice in the Hudson River hugged the shore of Manhattan amid a deep freeze.
Feb 4, 2026 Article 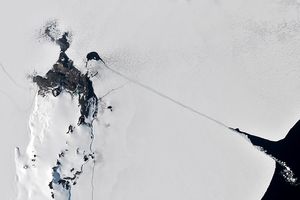
4 min read Icebreakers play a critical role in delivering supplies to America’s largest research base in Antarctica.
